
7.2 Stable Isotopes#
What are Stable Isotopes?#
Stable isotopes do not spontaneously break down to form other isotopes. Because of relative differences in masses of isotopes of an element, changes to isotopic ratios can be observed during various biogeochemical processes. Study of stable isotopes is useful in gaining better understanding in environmental and geological studies.
Stable isotopes are especially useful in elements whose isotopes have large relative mass differences. Therefore, most of the elements used for stable isotope studies have a low atomic number and atomic mass (Table 15). For isotopes with an atomic mass of greater than \(40\), the relative mass differences are too small for any measurable isotopic fractionation. Most elements used in radiometric dating have high atomic mass, and mass fractionation is not significant.
Element |
Isotope |
% |
|---|---|---|
H |
\(\ce{^1 H}\) |
\(99.985\) |
H |
\(\ce{^2 H}\) |
\(0.015\) |
C |
\(\ce{^{12} C}\) |
\(98.9\) |
C |
\(\ce{^{13} C}\) |
\(1.1\) |
N |
\(\ce{^{14} N}\) |
\(99.63\) |
N |
\(\ce{^{15} N}\) |
\(0.37\) |
O |
\(\ce{^{16} O}\) |
\(99.762\) |
O |
\(\ce{^{18} O}\) |
\(0.2\) |
Stable Isotope Fractionation#
Isotopic fractionation is the partitioning of isotopes during physical (evaporation, condensation, melting, crystallization, absorption and desorption, diffusion), chemical, or biological processes. This partitioning is proportional to the difference in the masses of the isotopes. The processes can either be equilibrium reactions, in which forward and backward reaction rates are equal for each isotope, or kinetic reactions, which are unidirectional reactions in which reaction rates are dependent on the masses of the isotopes and their vibrational energies.
Example: Stable isotope fractionation of \(\ce{H2O}\)
During evaporation of in a closed system, six isotope combinations of \(\ce{H2O}\) are possible: \(\ce{^1H2^{16}O}, \ce{^1H^2H^{16}O}, \ce{^2H2^{16}O}, \ce{^1H2^{18}O}, \ce{^1H^2H^{18}O}, \ce{^2H2^{18}O}\).
As a result of these different stable isotope combinations, the molecular masses are \(18\), \(19\), \(20\), \(20\), \(21\), and \(22\) respectively. See the conceptulizations in the figure below.

Why do stable isotopes fractionate? Isotopically lighter isotopes have higher velocities than heavier isotopes. From basic physics, kinetic energy of a particle can be calculated using the following formula:
Per Eqn. (73), isotopically lighter molecules that have higher velocities and therefore, greater amount of kinetic energy. Consider the above water example. Since the lighter molecules have greater velocities, they preferentially escape into the vapor phase resulting in enrichment of the lighter isotopes ( and ), relative to the liquid phase of water. In addition, atoms with greater mass form slightly stronger bonds, the heavier isotope is generally enriched in the more condensed phase or larger molecule.
Example: Fractionation of water between phases
Consider the equilibrium exchange of water between different phases:
As we know, the molecules of water are held together by weak hydrogen bonds. These intermolecular bonds are strongest in the solid phase and weakest in the vapor phase. In addition, there is slightly greater hydrogen bond strength for \(\ce{H2^{18}O-H2O}\) versus \(\ce{H2^{16}O-H2O}\) bonds, the \(\ce{^{16}O}\) bonds will be more easily broken during evaporation. Therefore a lower concentration of \(\ce{H2^{18}O}\) is present in the water vapor than in the liquid water, and so water is isotopically enriched over its vapor. Similarly, \(\ce{^{18}O}\) is more enriched in ice than in water.
Example: Fractionation of \(\ce{CaCO3}\) during dissolution
Consider the chemical weathering of limestone (\(\ce{CaCO3}\)):
In this reaction \(\ce{CO2}\) escapes and thus does not equilibrate with the solid phase. During a chemical reaction the lighter isotope is more reactive and is concentrated in the products. The relative loss of the lighter isotope from the reactants leads to an enrichment of the reactants in the heavier isotope. In this example, the gas phase (product) is enriched in the lighter isotopes of C and O, and the enrichment is significantly greater than that which would occur during an equilibrium reaction.
The partitioning of stable isotopes between two substances, \(A\) and \(B\), is described by the isotopic fractionation factor, \(\alpha\). The fractionation factor is written as
where, \(R\) is ratio of heavy to light isotope abundance (e.g., \(\ce{^2 H}\)/\(\ce{^1 H}\) , \(\ce{^{18}O}\)/\(\ce{^{16}O}\) ). Generally, the isotope abundance ratio does not greatly vary in the environment, and so the fractionation factor, \(\alpha\), generally has a value close to 1. However, this value can be precisely measured and so is expressed with a precision of 4-5 decimal places. The fractionation factor depends on the temperature and can be determined either experimentally or calculated from spectroscopic data.
Example: Isotope fractionation factor
Consider the evaporation of water. We can setup the fractionation ratio and factor as follows:
We can calculate \(\alpha\) as
Since \(\ce{^{16}O}\) is enriched in the vapor phase relative to the liquid,
Conversely, \(\ce{^{18}O}\) is enriched in the liquid relative to the vapor,
Therefore, the fractionation factor is greater than 1. With increasing temperature, the fractionation factor decreases, and it becomes 1 at infinite temperature.
In Fig. 52, isotope fractionation of \(\ce{O}\) as a function of temperature during evaporation of \(\ce{H2O}\) is shown. Paleoclimatologists use \(\ce{O}\) ratios (\(\ce{^{18}O}\)/\(\ce{^{16}O}\)) from \(\ce{H2O}\) trapped in glaciers as well as the \(\ce{O}\) absorbed in the shells of marine plants and animals to measure past temperatures and rainfall. In polar ice cores, the measurement is relatively simple: less \(\ce{^{18}O}\) in the frozen water means that temperatures were cooler. In shells, the measurement is far more complicated because the biological and chemical processes that form the shells skew the \(\ce{O}\) ratio in different ways depending on temperature.
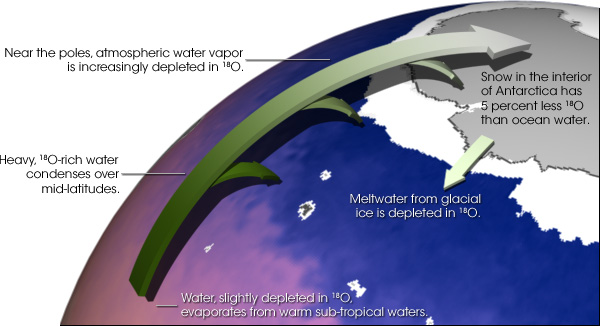
Fig. 52 Water vapor gradually loses \(\ce{^{18}O}\) as it travels from the equator to the poles. Because water molecules with heavy \(\ce{^{18}O}\) isotopes in them condense more easily than normal water molecules, air becomes progressively depleted in \(\ce{^{18}O}\) as it travels to high latitudes and becomes colder and drier. In turn, the snow that forms most glacial ice is also depleted in \(\ce{^{18}O}\). Image source: Paleoclimatology: The Oxygen Balance (nasa.gov)#
The isotopic fractionation factor is related to the equilibrium constant (\(K\)) of a reaction as follows:
Where \(K\) is the equilibrium constant and \(n\) is the number of atoms exchanged.
Example: Isotope fractionation factor and \(K\)
Consider the exchange of \(\ce{O}\) isotopes between carbonate (\(\ce{CaCO3}\)) and water. This particular reaction is of interest because it is used as a “paleothermometer” in marine systems. The fractionation factor can help determine temperature of water at the time of deposition of carbonate.
Let’s write the reaction in terms of a single oxygen, so \(n = 1\) in Eq. (75),
Writing this equation in terms of the equilibrium constant, \(K\),
Rearranging this equation with \(\ce{CaCO3}\) separated from \(\ce{H2O}\),
Therefore,
Because the isotopic fractionation factor varies as a function of temperature, the measured fractionation factor can be compared to emprirical values to determine the equilibrium temperature for the calcium carbonate-water reaction.
The \(\delta\) notation#
\(R\) values for environmental samples have to be compared with a fixed value (or a standard) to know if that sample is enriched or depleted compared to the standard.
Since isotopic variations between samples are very small, we express isotopic ratios using delta (\(\delta\)) notation. This value is determined by comparing the isotopic ratio (\(R\)) of a sample with that of a standard and calculated as follows:
Where the isotopic ratio, \(R\), has been defined in the previous section. Note that the ratio is multiplied by a thousand and is expressed in “parts per thousand” or permille or permil or the symbol, \(\pu{‰}\). As seen in Eqn. (76), \(R_\text{Standard}\) is required for the element of interest. Standards for most common elements of interest have been adopted worldwide for research purposes and shown in Table 16. Typically, V-SMOW (Vienna standard mean ocean water), and PDB (Pee Dee beleminite) are most commonly used for \(\ce{H}\), \(\ce{O}\), and \(\ce{C}\) ratios.
Isotope Ratio |
Standard |
\(R \times \pu{e-5}\) |
|---|---|---|
\(\ce{^2 H}\)/\(\ce{^1 H}\) |
V-SMOW |
\(15.575\) |
\(\ce{^{13} C}\)/\(\ce{^{12} C}\) |
PDB |
\(1123.75\) |
\(\ce{^{18} O}\)/\(\ce{^{16} O}\) |
V-SMOW |
\(200.52\) |
\(\ce{^{18} O}\)/\(\ce{^{16} O}\) |
PDB |
\(206.72\) |
\(\ce{^{15} N}\)/\(\ce{^{14} N}\) |
NBS-14 |
\(367.6 \) |
\(\ce{^{34} S}\)/\(\ce{^{32} S}\) |
CDT |
\(4499.4\) |
When \(\delta\) values are negative, \(R_\text{Sample} < R_\text{Standard}\) in Eqn. (76), therefore, the sample is considered to be depleted compared with the standard. Similarly, when \(\delta\) values are positive, \(R_\text{Sample} > R_\text{Standard}\), therefore, the sample is considered to be enriched compared to the standard.
Since the \(\delta\) values and the isotope fractionation factors (\(\alpha\)) are derived from isotopic ratios, they are correlated with each other. Once again, let’s look at fractionation of between water (liquid) and vapor and express the fractionation factor, \(\alpha\), in terms of the \(\delta \ce{^{18}O}\) values of the water and vapor by combining Eqn. (74) and Eqn. (76).
Example: \(\delta\) notation
A rainwater sample collected in Boston, Massachusetts, has an \(\ce{^{18} O}\)/\(\ce{^{16} O}\) ratio of \(0.0019750\). Calculate \(\delta\) for this rainwater sample.
From Table 16, we can read the isotopic ratio of \(\ce{^{18} O}\)/\(\ce{^{16} O}\) in V-SMOW to be \(0.0020052\). Substitute values in Eqn. (76) as follows:
Since this final value is negative, the sample isotopically lighter than the standard.
Stable isotopes and the water cycle#
Isotopes provide a great tool for distinguishing different water sources and recharge areas during analysis of the water cycle. The natural isotopes and are an intrinsic component of the water molecule and so are ideal tracers. They are selectively partitioned at each step of the water cycle, from primary evaporation over the oceans, through condensation and precipitation to groundwater recharge and runoff back to the seas.
The principal hydrological processes that affect the distribution of isotopes through the hydrological cycle include the following:
Evaporation and formation of atmospheric vapor
Condensation and rain out with decreasing temperature
Reevaporation from soils and surface waters, which enriches the residual water in both isotopes
Mixing during recharge and groundwater flow
Based on experimental observations of water isotopes around the world at different latitudes, it has been observed that \(\ce{^{18}O}\) and \(\ce{^{2}H}\) in freshwater are enriched in warm regions and depleted in cold regions, with a range of \(\delta \ce{^{18}O} > \pu{40 ‰}\) and \(\delta \ce{^{2}H} > \pu{300 ‰}\). In addition, there is a strong linear correlation between \(\delta \ce{^{18}O}\) and \(\delta \ce{^{2}H}\) in meteoric waters, with a slope of \(8\) and deuterium intercept of \(\pu{10}\). This linear correlation is called the Global Meteoric Water Line (GMWL) and describes the global annual average relationship between \(\delta \ce{^{18}O}\) and \(\delta \ce{^{2}H}\) in natural meteoric waters.

Fig. 53 Global relationship between \(\delta \ce{^{18}O}\) and \(\delta \ce{^{2}H}\) (\(\delta\)D) in water samples. The line shown is called the global meteoric water line. Image source: Global meteoric water line - Wikipedia#
The mean global meteoric water line (GMWL) is based on numerous analyses of meteoric waters collected at different latitudes and represents a global average. Local meteoric water lines are determined by measuring the isotopic composition of meteoric waters from a restricted geographic area.
The Local Meteoric Water Line (LMWL) can diverge from the GMWL depending on the climate of that region. The LMWL can differ from GMWL in slope and intercept - the deviation is mainly from climate factors that impact precipitation patterns.

Fig. 54 Local relationship (LMWL) between \(\delta \ce{^{18}O}\) and \(\delta \ce{^{2}H}\) (\(\delta\)D) in water samples from a study in China. Compare the equations with the GMWL shown in the previous figure Image source: Oxygen and Hydrogen Isotopes of Precipitation in a Rocky Mountainous Area of Beijing to Distinguish and Estimate Spring Recharge (mdpi.com)#