
2.2 Field and Lab Analyses#
Studying the CZ requires pursuing unique research questions, hypotheses testing, and experimental designs. A common aim for researchers is to use common measurements that can be used to compare CZ processes and function across all CZ study sites. In effect, common measurements mean the sum of the network is greater than its parts. The methods include the use of carbon isotopes, rock and soil profile weathering rates, stream discharge, demographics, and soil carbon. In addition, research activities include data analysis and communication while using real data to interpret CZ processes and begin to think about human interactions in the CZ.
CZ scientists seek to quantify, through a common set of measurements:
CZ structure and evolution
Event-based and continuous fluxes across CZ interfaces
Changes in budgets, including energy, water, solutes and sediment
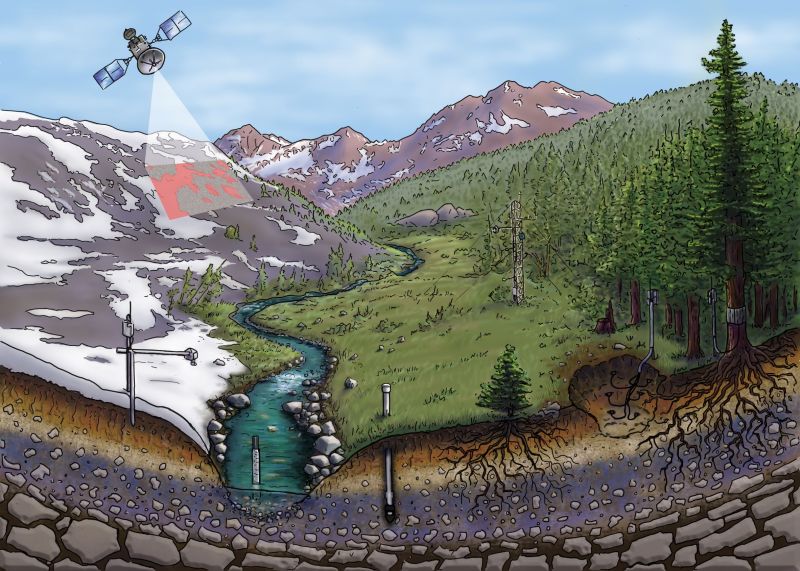
Fig. 5 Infrastructure used to study the Earth’s CZ—the layer between the forest canopy and the base of weathered bedrock. Image source: No soils, no life | NSF#
Below are examples of the methods used to collect various types of data.
Land-Atmosphere Interface#
Energy and materials in different forms are exchanged between land and the atmosphere. The primary materials include carbon and water in many different forms. An advanced research instrument that’s incorporated in many CZOs is an eddy covariance or eddy flux tower.
An eddy covariance tower is a type of atmospheric measurement device that is used to quantify the exchange of carbon dioxide, water vapor, and energy between the land surface and the atmosphere. It typically consists of a tall tower equipped with various instruments, including sensors for measuring wind speed and direction, temperature, humidity, and atmospheric pressure. The data collected by an eddy flux tower provides insights into the processes controlling the exchange of energy, water, and carbon between the land and atmosphere, which is important for understanding the Earth’s carbon cycle and the effects of climate change.
The NSF-funded NEON (National Ecological Observatory Network) has several eddy covariance towers installed across the US based on “ecoclimatic domains that represent distinct regions of vegetation, landforms, and ecosystem dynamics to capture the full range of U.S. ecological and climatic diversity” (NSF NEON | Open Data to Understand our Ecosystems). The data from these observatories are available at Data Portal | NSF NEON. Data from these sites can be an excellent supplement to data from nearby CZOs.

Fig. 6 Field sites operated by NSF-funded NEON across the US. Image source: Field Sites | NSF NEON#
The eddy covariance method is often deployed following a thorough evaluation of the landscape using remote sensing techniques including, LiDAR (light detection and ranging) techniques. These techniques have applications in wide-ranging fields such as archeology, geomorphology, seismology, forestry, and self-driving automobile technologies.
Vegetation and Associated Microbiota#
Carbon in a dead, rotting animal or rotting leaves eventually end up in the atmosphere. To understand this important carbon cycling process, we need to understand the following about soil—what lives in soil, what soil is made of, and how soil behaves under different environmental conditions.
When we stand on soil, we are standing on an important reservoir of the carbon cycle, one that has great potential to add large amounts of carbon to the atmosphere if global climate continues to warm. Conversely, many ranchers, farmers and soil scientists now feel that soil may also be a solution to rising levels of atmospheric \(\ce{CO2}\).
Like oceans, soils are highly complex ecosystems where the carbon cycle interacts with other biogeochemical cycles such as nitrogen, phosphorus and sulfur. And, to add to soil’s complexity, microbes that live in the soil mediate many of these biogeochemical interactions in addition to driving important carbon cycle processes.
Carbon stored in soil#
In soils, you can find carbon in both organic carbon compounds and inorganic carbon compounds. In most soils, carbon exists predominately in the form of soil organic carbon (SOC).

Fig. 7 Carbon-rich humus can be seen in the dark uppermost level of soil. Image source: 5A: Soil, Carbon and Microbes (carleton.edu)#
Soil organic carbon (SOC) is the main constituent of soil organic matter (SOM). SOM is formed by the biological, chemical and physical decay of organic materials on the soil surface and below the ground. Basically, soil organic matter (SOM) is composed of anything that once lived, including:
organic bits and pieces of plant and animal remains in various stages of decomposition, sloughed off cells and tissues of soil organisms, and substances from plant roots and soil microbes.
living soil microbes (bacteria, fungi, archaea, nematodes and protozoa) and plant roots. If we weighed all of the organisms found in soil, soil microbes would comprise about 90-95% of that weight.
humus, a chemically stable type of organic matter composed of large, complex organic carbon compounds, minerals, and soil particles. Humus is resistant to further decomposition unless disturbed by a change in environmental conditions. If undisturbed, humus can store soil carbon for hundreds to thousands of years. This makes humus a very important carbon sink.
charcoal (biochar), incompletely burned plant material. Charcoal can remain undecomposed in the soil for decades to centuries.
Carbon balance within soil#
In Fig. 8 the flow of carbon into and out of soil is shown. If plants transfer more carbon into soil than is released via soil respiration, more carbon will get stored in humus via the process of humification.
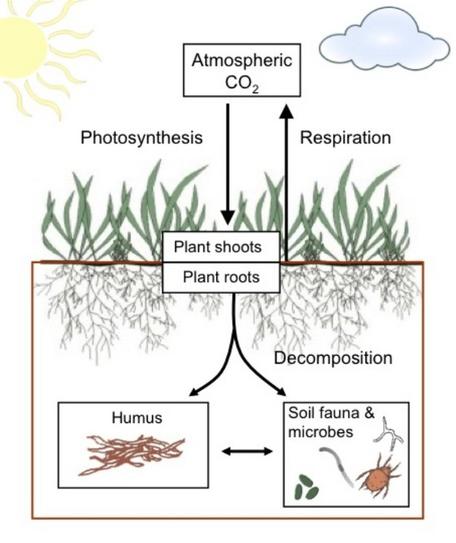
Fig. 8 Soil Carbon Storage: Carbon balance within the soil (brown box) is controlled by carbon inputs from photosynthesis and carbon losses by respiration. Image source: 5A: Soil, Carbon and Microbes (carleton.edu)#
For years, soil scientists and farmers have known that carbon can persist for long periods of time in carbon-rich humus. Humus is formed when soil organic material is degraded by soil microbes that reside in the soil. However, humus is a very complex substance and not fully understood. Current research indicates that the length of time soil carbon persists in humus and other SOM components depends on many ecosystem interactions between SOM and microbes, minerals, moisture and temperature. Scientists do not know yet how long this carbon will stayed stored in soil or if environmental disturbances will move large amounts into the atmosphere amplifying climate change.
Soil and Vadose Zone#
The solid and unsaturated (vadose zone) phases inside of soils provide very useful information about the make-up of the soil and their specific functions within the CZ. The soil pit in the video below shows the vadose zone and the CZ.
Geophysical techniques are used to study to the vadose zone in a noninvasive manner. See Multiscale geophysical imaging of the CZ - Parsekian - 2015 - Reviews of Geophysics - Wiley Online Library
Gas sensors are also deployed to study infiltration of water through the vadose zone.
Saprolite and Bedrock#
During soil formation, bedrock weathers into regolith – (includes weathered rock, saprolite, and soil) – porosity grows, guides fluid flow, and releases nutrients from minerals. These vital processes that transform bedrock into soil are poorly understood, especially in deep regolith, where direct observations are difficult. The previously mentioned geophysical techniques become useful to this part of the CZ.
Hollow-bore coring of bedrock allows retrieval of rock and regolith samples for studying this part of the CZ. These samples provide information about porosity, permeability, fractures, faults, mineralogy, etc.
Surface water#
Natural streams and irrigation channels move water across broad and varied landscapes. A variety of methods and infrastructure are often used to monitor and control stream behavior.
USGS maintains an extraordinary network of stream monitoring stations across many streams systems in the US. These monitoring efforts include measurement of stream levels and discharge, meteorology, groundwater, and water chemistry and health. In addition to information about water quantity and quality, we have information about flood status as well as water availability.
To access and view data, see USGS | National Water Dashboard.
More information about common measurements, including a matrix showing which observatories currently collect various measurements, can be found in the 2015 CZO common measurements white paper CZO common measurements white paper.
Mini-Project #3
Part A:
Complete an annotated bibliography of the research topic you selected. Your bibliography should include the following:
(1) Select a general, CZ related topic that you would like to investigate. This topic should be in the form of a question. For example, a reasonable question could be “How does vegetation affect soil formation in different ecosystems?”
(2) Once you have selected a topic, you should find five research articles that relate to the topic you have selected. Once you have settled on the most appropriate sources that relate to your topic, you should complete these tasks for each of five sources, only where they relate directly to your topic:
List the sources as you would in a bibliography using a consistent format such as the Chicago Manual of Style format.
Identify and list the related research question(s) that the author(s) are investigating.
Identify the related methods that are used to investigate the question and how do those methods relate to your research question?
Identify the type of data that the authors generated and how did they interpret them? Identify what relevant conclusions the authors drew from their data?
(3) Once you have completed this analysis, refine your research question. For example, based on the question above, you might ask: “How does vegetation litter affect the base status of soils in high-elevation coniferous forests?”
Part B:
Visit your assigned CZO site, select and download a time series data collected at this site. Typically, they are available for a stream site.
Use this link to go to your site and filter the different type of data available: CUAHSI HydroClient
Using data from the CZO database, produce:
A simple line graph with best-fit slope trendline and the equation of slope
A bar graph with a paired data set that calculates and plots the average and standard deviation.
An XY graph with an appropriate trendline
A data histogram
Each graph should be clearly laid-out and labeled. Each data set should be at least 48 rows. Briefly summarize the source of the data, what your graph illustrates and what insight your graphical analysis has given you.
Readings and resources for this section#
For examples of how these techniques were used to characterize the CZ, see: