
4.2 Carbon Budget#
We will analyze carbon flux data collected at various scales to understand the regional exchange of carbon at an Ameriflux or CZO site. This relates to the grand challenge of understanding atmospheric gases and biogeochemical/carbon cycling. This unit also relates to the geoscience literacy themes of Earth system changes that occur at multiple scales and the interconnections between the carbon and energy and water cycles.
You will:
Use a carbon cycle diagram to discuss the different pathways of carbon at a watershed scale.
Contrast global and biome-specific carbon budgets to better understand watershed-scale processes.
Relate carbon flux data collected at various scales to understand the regional exchange of carbon at an Ameriflux site.
Explore and visualize carbon flux data from the Ameriflux database.
Use carbon flux data from the Ameriflux database to support a simple hypothesis relating carbon flux to driving environmental variables.
Carbon Cycle#
Carbon is the foundation of all life on Earth, required to form complex molecules like proteins and DNA. This element is also found in our atmosphere in the form of \(\ce{CO2}\). Carbon helps to regulate the Earth’s temperature, makes all life possible, is a key ingredient in the food that sustains us, and provides a major source of the energy to fuel our global economy.
The carbon cycle describes the process in which carbon atoms continually travel from the atmosphere to the Earth and then back into the atmosphere. Since our planet and its atmosphere form a closed environment, the amount of carbon in this system does not change. Where the carbon is located — in the atmosphere or on Earth — is constantly in flux.
On Earth, most carbon is stored in rocks and sediments, while the rest is located in the ocean, atmosphere, and in living organisms. These are the reservoirs, or sinks, through which carbon cycles.
Carbon is released back into the atmosphere when organisms die, volcanoes erupt, fires blaze, fossil fuels are burned, and through a variety of other mechanisms.
In the case of the ocean, carbon is continually exchanged between the ocean’s surface waters and the atmosphere, or is stored for long periods of time in the ocean depths.
Humans play a major role in the carbon cycle through activities such as the burning of fossil fuels or land development resulting in a rapid increased in \(\ce{CO2}\) in the atmosphere.
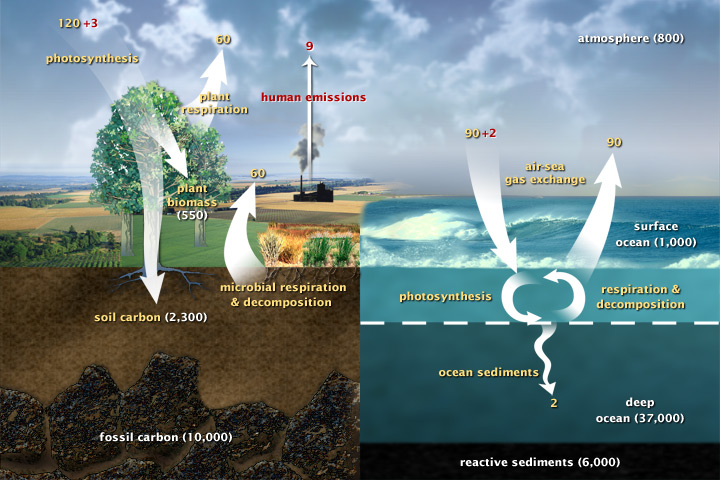
Fig. 28 The fast carbon cycle shows the movement of carbon between land, atmosphere, and oceans. Yellow numbers are natural fluxes, and red are human contributions in gigatons of carbon per year. White numbers indicate stored carbon. Image source: The Carbon Cycle (nasa.gov)#
Carbon Budget#
Energy flow refers to the movement of energy through an ecosystem, from the external environment (the Sun) through a series of organisms and back to the external environment (space). It is a fundamental process common to all ecosystems.
In ecosystems energy flow is what distinguishes life and life-supporting systems from the rest of the universe. All life requires energy. Our body mass is a delicate balance between the energy we take in through food and the energy we use through activities; what we don’t use, we store. This is true not only of people, but also of other organisms, and of populations, communities, ecosystems, biomes, and the biosphere.
Two aspects of energy and its role in ecosystems are essential to an understanding of energy and life. The first is the functions of energy in living systems, especially its involvement in the production of organic matter in ecosystems, which can tell us about the ultimate limits on the abundance of life. The second is the pathways through which energy flows, the efficiency with which it is used, and the role it plays in the various processes of life.

Fig. 29 Schematic representation of the overall perturbation of the global carbon cycle caused by anthropogenic activities, averaged globally for the decade 2010–2019. Image source: ESSD - Global Carbon Budget 2020 (copernicus.org)#
Photosynthesis#
The basic function of energy in a life-supporting system is to make possible the production of organic matter. The amount of usable energy in a system provides an upper limit on the amount of organic matter, and thus the amount of life that can be sustained by any ecosystem, and ultimately by the Earth system as a whole.
Photosynthesis is the only biological process that can capture energy that originates from sunlight and converts it into chemical compounds (carbohydrates) that every organism uses to power its metabolism. It is also a source of oxygen necessary for many living organisms. In brief, the energy of sunlight is “captured” to energize electrons, whose energy is then stored in the covalent bonds of sugar molecules.
Plants, algae, and a group of bacteria called cyanobacteria are the only organisms capable of performing photosynthesis. Because they use light to manufacture their own food, they are called photoautotrophs (literally, “self-feeders using light”). Other organisms, such as animals, fungi, and most other bacteria, are termed heterotrophs (“other feeders”), because they must rely on the sugars produced by photosynthetic organisms for their energy needs. A small group of bacteria synthesize sugars, not by using sunlight’s energy, but by extracting energy from inorganic chemical compounds and are called chemoautotrophs.
Photosynthesis is a multi-step process that requires specific wavelengths of visible sunlight, \(\ce{CO2}\) (which is low in energy), and \(\ce{H2O}\) as substrates. After the process is complete, it releases \(\ce{O2}\) and produces simple carbohydrate molecules (high in energy) that can then be converted into glucose, sucrose, or any of dozens of other sugar molecules. These sugar molecules contain energy and the energized carbon that all living things need to survive.
Note that the total amount of organic matter on Earth or in any particular ecosystem is called the biomass of that system. This includes all living things and all products of living things. Most of life is on or close to Earth’s surface, so biomass is usually measured as an amount per unit surface area.
Primary producers convert energy and inorganic compounds into biomass, in the form of carbon-based organic compounds. There are three steps in the production of biomass and its use as a source of energy by autotrophs. First, the autotrophic organism produces organic matter within its body (by photosynthesis or, less commonly, by chemosynthesis); then it uses some of this new organic matter as a fuel in metabolism and respiration, releasing energy back to the surrounding environment in the form of heat; finally, it stores some of the newly produced organic matter for future use, in the form of carbon-based compounds.
The first step, production of organic matter before any use, is called gross production. The biomass that is left over from gross production after it has been used to fuel the processes of life (the second step) is called net production. In these terms,
where, \(NPP\) is net primary production, \(GPP\) is gross primary production and \(Re\) is respiration. This is a fundamental production relationship.
Respiration#
Carbohydrates made during photosynthesis are of value to a plant when they are converted to energy. This energy is used for cell growth and building new tissues. The chemical process by which sugars and starches are converted to energy is called oxidation and is similar to the burning of wood or coal to produce heat.
Organisms that derive food energy by feeding on other organisms or on organic compounds produced by other organisms are called heterotrophs. When heterotrophs consume another organism, the energy stored in the organic compounds is released by one of two metabolic processes. Organisms that cannot tolerate oxygen obtain their energy through the anaerobic process of fermentation, in which carbohydrate molecules release energy as they are partially decomposed to form alcohol, carbon dioxide, and water. Heterotrophs that are oxygen-tolerant obtain their energy through the aerobic (oxygenated) process of respiration (or cellular respiration), which means that they use oxygen to break down carbohydrates, releasing carbon dioxide, water, and energy. Respiration is many times more efficient than fermentation as a metabolic process.
Allocation#
The partitioning of the primary products of photosynthesis into different functional pools is termed carbon (C) allocation. Several conceptual frameworks were developed decades ago to describe plant allocation strategies in terms of a functional equilibrium between aboveground and belowground organ biomass. Allocation has also been described as a trade-off in resource partitioning between different functional sinks, like growth and defense in the presence of herbivores and pathogens.
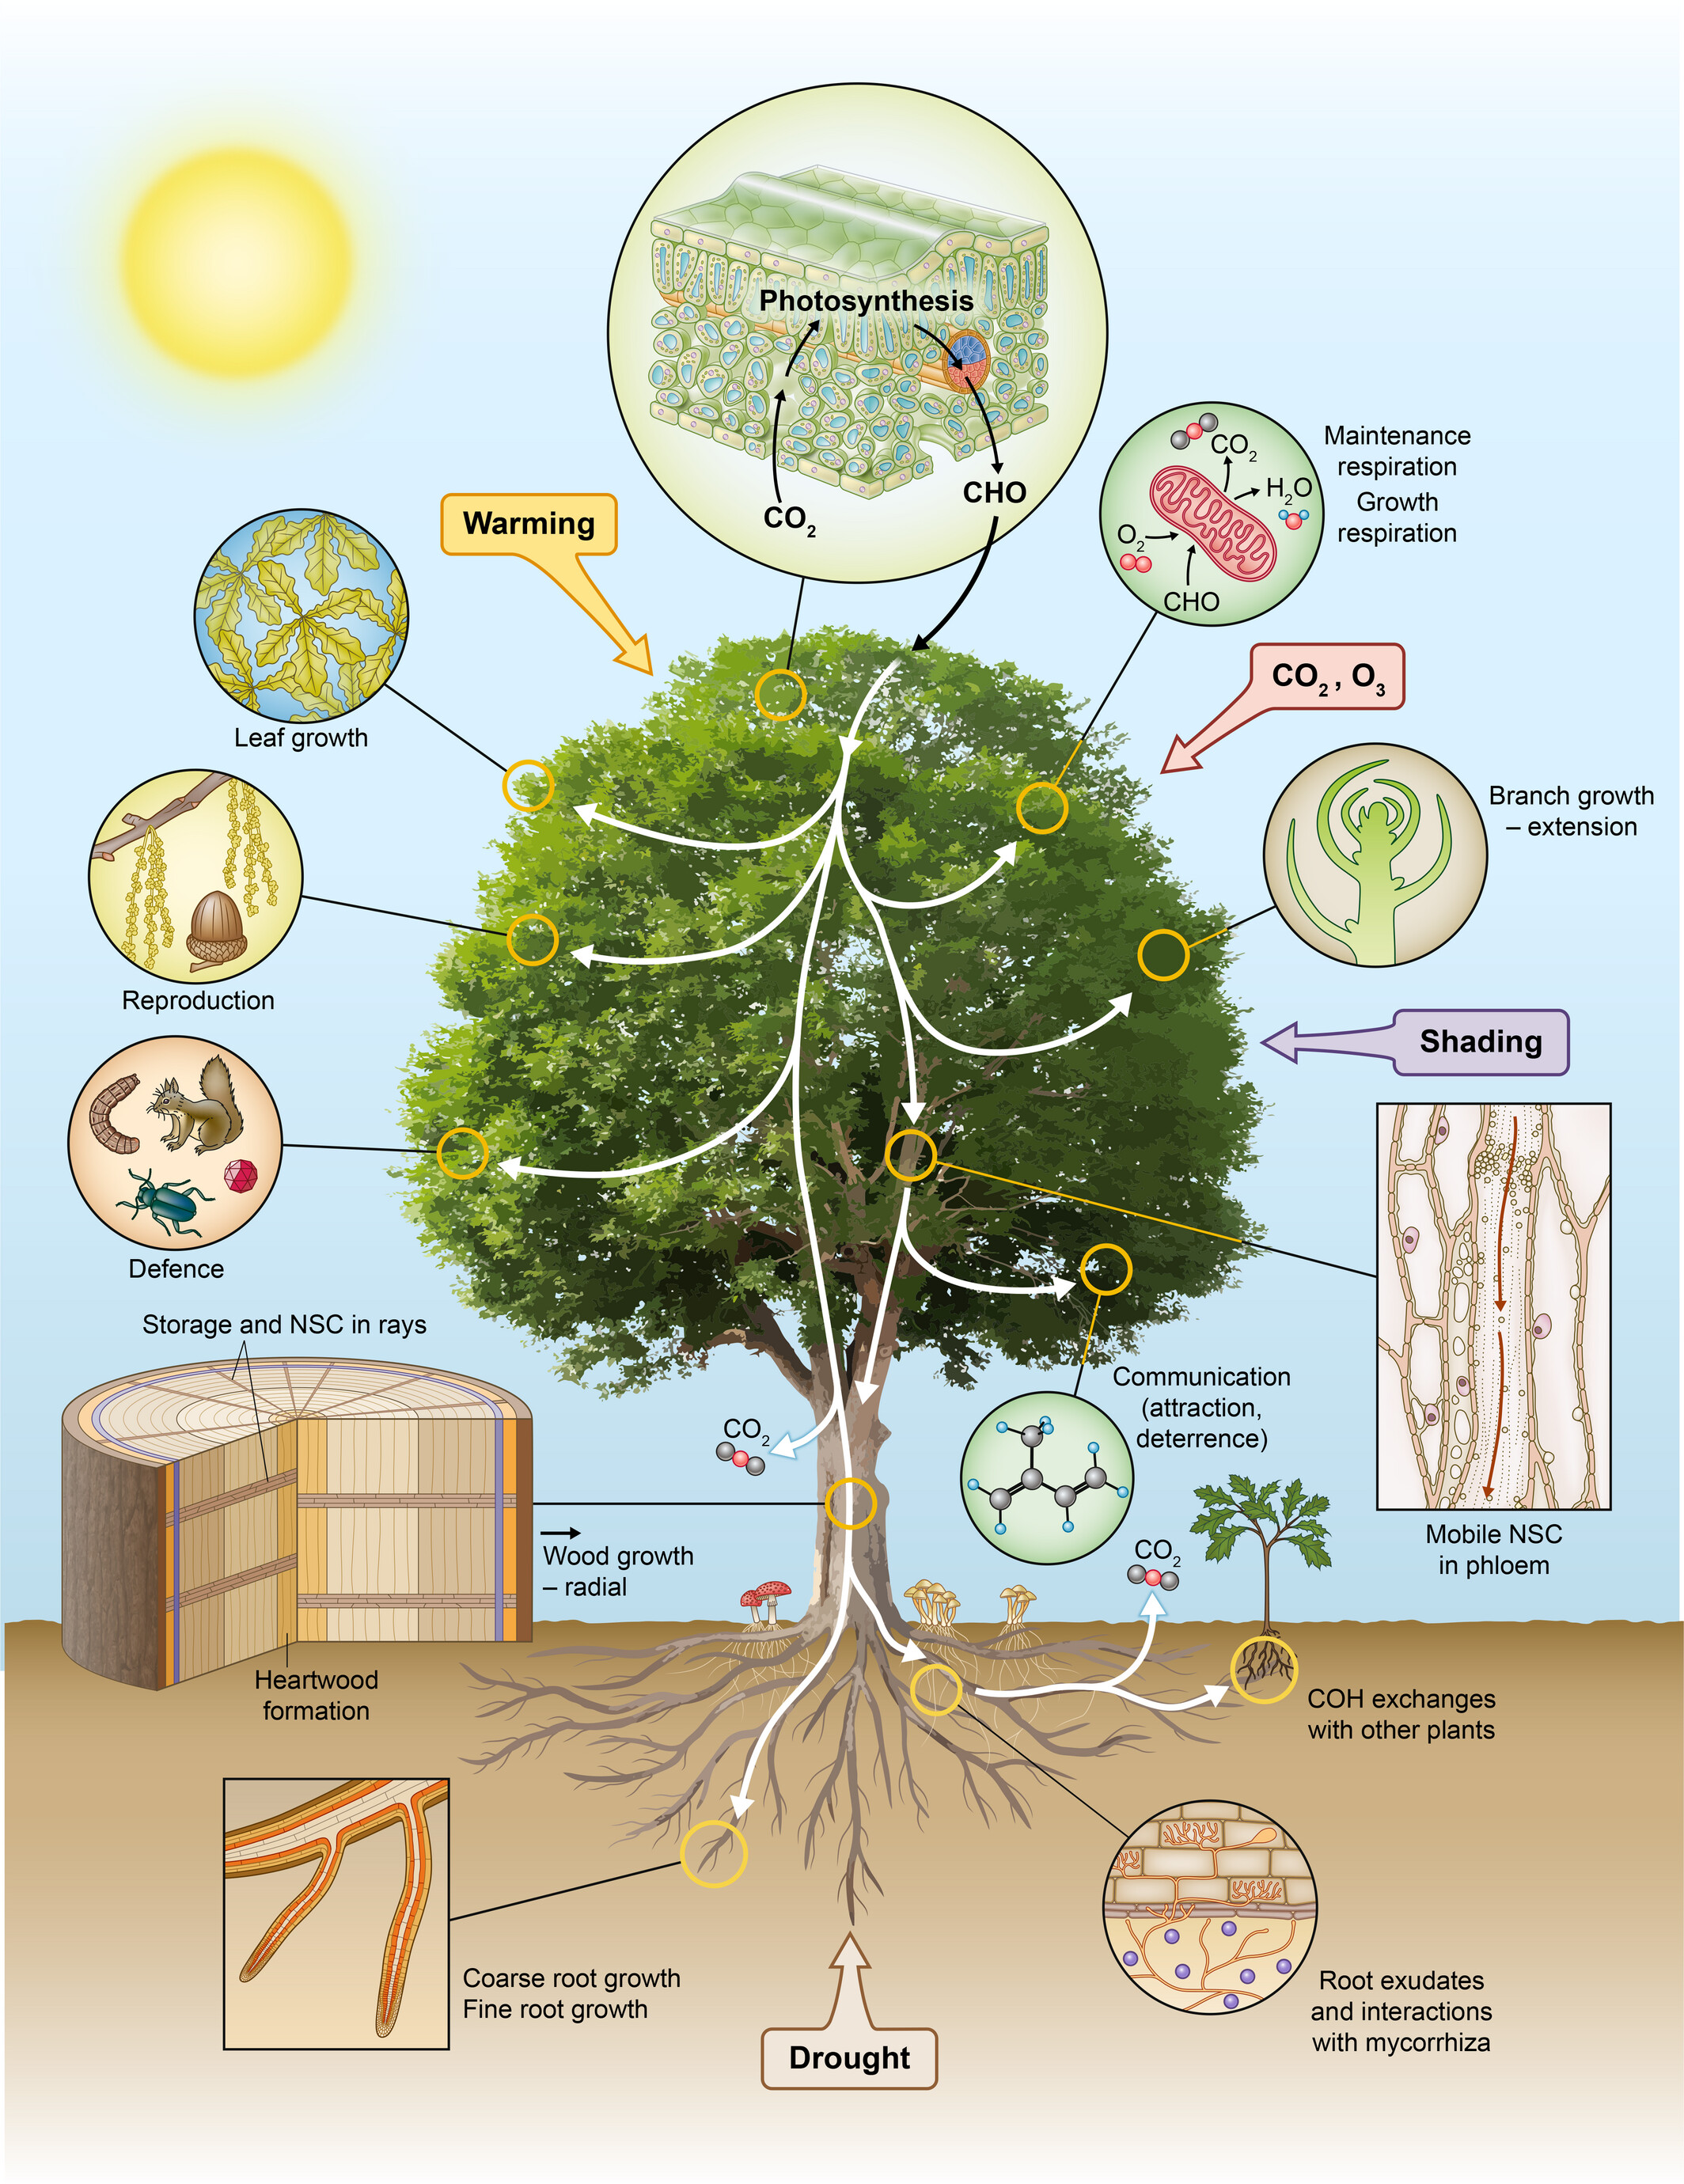
Fig. 30 Plant carbon allocation in a changing world. Plants allocate carbohydrates produced during photosynthesis to support maintenance, growth, development, and reproduction as well as defence and communication. NSC, nonstructural carbohydrates. Image source: Plant carbon allocation in a changing world – challenges and progress - New Phytologist#
The allocation of carbon depends on the ecosystem type, its components, and the interactions between them. Carbon allocation to plant biomass can be shown as
Where:
\(\frac{dC_{biomass}}{dt}\) is the rate of change in plant biomass carbon stock
\(α_{biomass}\) is the fraction of \(NPP\) allocated to plant biomass growth
Environmental parameters, like temperature, precipitation and atmospheric \(\ce{CO2}\) or ozone concentrations, influence these processes either directly (e.g. heat damage) or by influencing the availability of carbohydrates (e.g. reduction of photosynthetic rates). Plants respond to changes in environmental conditions by shifting the partitioning of available carbon among organs (e.g. aboveground vs belowground growth, reproduction) and/or functional metabolites (e.g. synthesis of cellulose for growth vs production of defense compounds). Such plant responses define allocation strategies, most of which are still not well understood in the context of climate change.
Controls on NPP#
The main controls on \(NPP\) can be categorized into environmental factors and biological factors.
Environmental Factors:
Light availability: Photosynthesis is driven by the energy from sunlight, so the amount of available light is a critical factor for \(NPP\). Light availability is influenced by latitude, season, cloud cover, and canopy structure in forests.
Temperature: Photosynthesis and respiration rates are temperature-dependent, with an optimum range for most plant species. Temperatures that are too low or too high can limit \(NPP\).
Water availability: Water is essential for photosynthesis and plant growth. Drought conditions can severely limit \(NPP\), while excessive water can also be detrimental.
Nutrient availability: Plants require nutrients such as nitrogen, phosphorus, and potassium for growth and development. Nutrient limitations in the soil can constrain \(NPP\).
\(\ce{CO2}\) concentration: Higher atmospheric \(\ce{CO2}\) concentrations can increase photosynthetic rates and potentially boost \(NPP\), although other factors may limit the response.
Biological Factors:
Plant species composition: Different plant species have varying photosynthetic efficiencies, growth rates, and resource requirements, which can influence \(NPP\) at the ecosystem level.
Plant functional traits: Traits such as leaf area, leaf lifespan, root architecture, and wood density can affect the efficiency of resource acquisition and utilization, impacting \(NPP\).
Plant age and development: \(NPP\) generally increases as plants mature, reaches a maximum at an intermediate age, and then declines as plants senesce.
Herbivory and disturbances: Herbivores consuming plant biomass, as well as disturbances like fires, storms, and human activities, can reduce \(NPP\).
Competition and facilitation: Interactions between plants, such as competition for resources or facilitative effects, can influence NPP at the community level.
These environmental and biological factors interact in complex ways to determine the overall \(NPP\) of an ecosystem. Changes in these factors, such as those driven by climate change or land-use practices, can significantly impact the carbon cycling and productivity of terrestrial ecosystems.
Carbon Relationships#
The main equations that cover the carbon budget on Earth (or the CZ) involve tracking the exchange of carbon between different reservoirs or pools, including the atmosphere, terrestrial biosphere (plants and soils), oceans, and geological reservoirs (fossil fuels and sedimentary rocks). Some of these pools (e.g., oceans) do not apply in the CZ context.
Here are some of the key equations used to quantify the carbon budget:
Atmospheric Carbon Balance:
\[\frac{dC_{atm}}{dt} = E_{ff} + E_{luc} - S_{ocean} - S_{land}\]Where:
\(\frac{dC_{atm}}{dt}\) is the rate of change in atmospheric carbon dioxide (\(\ce{CO2}\)) concentration
\(E_{ff}\) is the emission from fossil fuel combustion and industrial processes
\(E_{luc}\) is the emission from land-use change (e.g., deforestation)
\(S_{ocean}\) is the uptake of carbon by the oceans
\(S_{land}\) is the uptake of carbon by terrestrial ecosystems
Ocean Carbon Uptake:
\[S_{ocean} = k_g \times (p\ce{CO2}_{,atm} - p\ce{CO2}_{, ocean})\]Where:
\(k_g\) is the gas transfer coefficient
\(p\ce{CO2}_{, atm}\) is the partial pressure of \(\ce{CO2}\) in the atmosphere
\(p\ce{CO2}_{, ocean}\) is the partial pressure of \(\ce{CO2}\) in the ocean surface waters
Terrestrial Biosphere Carbon Uptake:
\[S_{land} = NPP - R_h - D\]Where:
\(NPP\) is the net primary production (the amount of carbon fixed by plants through photosynthesis)
\(R_h\) is the heterotrophic respiration (the release of carbon from the decomposition of organic matter)
\(D\) is the disturbance flux (e.g., fires, deforestation)
Geological Carbon Reservoir Balance:
\[\frac{dC_{geo}}{dt} = F_{burial} - F_{weathering} - E_{ff}\]Where:
\(\frac{dC_{geo}}{dt}\) is the rate of change in the geological carbon reservoir
\(F_{burial}\) is the flux of carbon burial in sedimentary rocks
\(F_{weathering}\) is the flux of carbon release through rock weathering processes
\(E_{ff}\) is the emission from fossil fuel combustion
Climate-Carbon Cycle Feedback Relationship:
\[NPP = f(T, P, \ce{CO2}) R_h = g(T, P, \ce{CO2})\]Where:
\(NPP\) and \(R_h\) are functions of temperature (\(T\)), precipitation (\(P\)), and atmospheric \(\ce{CO2}\) concentration
\(f\) and \(g\) represent the functional relationships between these variables and the carbon fluxes
Mini-Project #5
Part A
Now that you are familiar with using ArcGIS online version to make basic maps, make a comprehensive portfolio of maps of your CZO. Start at SCGIS Laboratory - College of Charleston.
Task 1: Click on Map at the top to start a new map. Remember to Save the map after each of the following tasks. To Print a map, click on the Print icon on the left, add an appropriate title and change “File format” to JPG. Click “Advanced Options” and add your name. Check the “Include Legend” box. Click “Export”. This step takes a minute or so and the map link appears below the “Exported Files”.
Task 2: Click on the Base Map tool on the left and add USGS National Map from the Living Atlas dropdown menu. This is a very detailed map and shows water and topographical features in very high resolution. Make this your Base Map.
Task 3: Go to StreamStats | U.S. Geological Survey and create a watershed for your site. Study existing information for your CZO to identify the general boundary of the areas of interest. Download the Layer to your computer and import it into the map you just created. Print this map. Make this layer transparency 25% so that the underlying basemap is visible.
Task 4: Add the following layers to your map, one at a time and print a map:
ESRI Hydro Reference Overlay
Live Stream Gages
Predominant Major Forest Carbon Pools of the Continental United States
Sentinel-2 10m Land Use/Land Cover Change from 2018 to 2021
State Geologic Map Compilation
StreamStats Layer for main watershed (imported from StreamStats)
Terrain Slope Map
USA Flood Hazard Areas
USA NAIP Imagery: Natural Color
USA NAIP Imagery: NDVI
USA Soil Map Units
Task 5: Copy and paste each map in Word on a separate sheet. Below each map include a short summary (~100 words) of the main information from each map.
Task 6: Given all the information from these maps, describe how they help explain the nature of the CZ at these sites.
Part B
Go to AmeriFlux and Sign In using the username and password you created.
Navigate to the sites closest to the CZO you are studying. Click on the “Site Publication” to identify the major publications for this site.
Identify TWO recent journal articles that address carbon/land-atmosphere fluxes for this site. For each article do the following:
Task 1: Include the full citation and write a 150-200 word summary of the article.
Task 2: Identify the main data collected and the mass and energy balance equations used to make connections to the data collected in this study.
Task 3: Include one or two figures that best summarize the main data in the papers and add a short description of how they are important.